Showing posts with label color. Show all posts

Friday, November 22, 2024

Brighten an \includeimage image in LaTeX Using decodearray without modifying the file

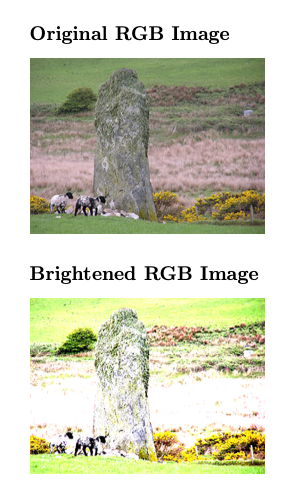
You can adjust the brightness of \includegraphics images in LaTeX without editing them!

The decodearray option in the graphicx package allows you to modify the appearance of images directly within your document.
This is especially useful if you need to tweak image brightness directly in your document without relying on external image editing tools.
The decodearray feature relies on PDF features supported by modern LaTeX engines  such as LuaLaTeX or XeLaTeX. 

\documentclass{article}
\usepackage{graphicx}
\begin{document}

% Original RGB image
\section*{Original Image}
\includegraphics[width=0.5\textwidth]{example-image.jpg}

% Brightened image using decodearray
\section*{Brightened RGB Image}
\includegraphics[width=0.5\textwidth, decodearray={0.2 0.5   0.2 0.5   0.2 0.5}]{uiskentuie_standing_stone.png}


\end{document}


In the example decodearray={0.2 0.5    0.2 0.5    0.2 0.5} maps the original range [0, 1] for each one of the three RGB channels to a narrower, brighter range [0.2, 0.5].

source: https://tex.stackexchange.com/questions/29227/can-includegraphics-be-used-to-change-an-image-color/150219#150219

Thursday, September 2, 2021

Conditional formatting LaTeX tables depending on cell values

A package for generating conditional formatted LaTeX tables that extends the one proposed in a post by Siavoosh Payandeh Azad. I've just extended it with the command \gradientd for a divergent colormap. There are also several other solutions discussed in this stackexchange post. The example can be seen in Overleaf here.


The code for generating the table

\documentclass[table]{article}
\usepackage{highlight}

\begin{document}

% For a 2 color palette
% \gradientcell{cell_val}{min_val}{max_val}{colorlow}{colorhigh}{opacity} 

% For a 3 color/divergent palette
% \gradientcelld{cell_val}{min_val}{mid_val}{max_val}{colorlow}{colormid}{colorhigh}{opacity}

% Configure a shorthand macro
\newcommand{\g}[1]{\gradientcelld{#1}{-3}{0}{3}{red}{white}{green}{70}}

\begin{tabular}{l|ccccc}
{$\sigma$} &  40  &   80  & 100  &   200 &  800 \\
\hline
0  & \g{ 0.87} & \g{ 0.84} & \g{ 1.04} & \g{ 1.34} & \g{-4.30} \\
5  & \g{ 0.38} & \g{ 0.22} & \g{ 0.33} & \g{ 0.58} & \g{-2.18} \\
10 & \g{ 0.29} & \g{ 0.04} & \g{ 0.11} & \g{ 0.48} & \g{-0.67} \\
25 & \g{-0.05} & \g{-0.34} & \g{-0.39} & \g{-0.48} & \g{-0.53} \\
50 & \g{ 0.04} & \g{-0.18} & \g{-0.13} & \g{-0.08} & \g{ 0.11} \\
\end{tabular}

\end{document}

The package highlight.sty  implement these commands  

%% Siavoosh Payandeh Azad Jan. 2019
%% modified by Gabriele Facciolo Sep. 2021
\ProvidesPackage{highlight}[Cell background highlighting based on user data]
\RequirePackage{etoolbox}
\RequirePackage{pgf} % for calculating the values for gradient
\RequirePackage{xcolor} % enables the use of cellcolor make sure you have [table] option in the document class 

%======================================
% For a 2 color palette
% \gradientcell{cell_val}{min_val}{max_val}{colorlow}{colorhigh}{opacity} 
\newcommand{\gradientcell}[6]{
    % The values are calculated linearly between \midval and \maxval
    \ifdimcomp{#1pt}{>}{#3 pt}{\cellcolor{#5!100.0!#4!#6}#1}{
    \ifdimcomp{#1pt}{<}{#2 pt}{\cellcolor{#5!0.0!#4!#6}#1}{
         \pgfmathparse{int(round(100*(#1/(#3-#2))-(#2 *(100/(#3-#2)))))}
        \xdef\tempa{\pgfmathresult}
        \cellcolor{#5!\tempa!#4!#6}#1
    }}
 }
%======================================

%======================================
% For a 3 color/divergent palette % \gradientcelld{cell_val}{min_val}{mid_val}{max_val}{colorlow}{colormid}{colorhigh}{opacity} \newcommand{\gradientcelld}[8]{ \xdef\lowvalx{#2}% \xdef\midvalx{#3}% \xdef\maxvalx{#4}% \xdef\lowcolx{#5}% \xdef\midcolx{#6}% \xdef\highcolx{#7}% \xdef\opacityx{#8}% % The values are calculated linearly between \midval and \maxval \ifdimcomp{#1pt}{>}{\maxvalx pt}{\cellcolor{\highcolx!100.0!\midcolx!\opacityx}#1}{ \ifdimcomp{#1pt}{<}{\midvalx pt}{% \ifdimcomp{#1pt}{<}{\lowvalx pt}{\cellcolor{\midcolx!0.0!\lowcolx!\opacityx}#1}{ \pgfmathparse{int(round(100*(#1/(\midvalx-\lowvalx))-(\lowvalx*(100/(\midvalx-\lowvalx)))))}% \xdef\tempa{\pgfmathresult}% \cellcolor{\midcolx!\tempa!\lowcolx!\opacityx}#1% }}{ \pgfmathparse{int(round(100*(#1/(\maxvalx-\midvalx))-(\midvalx*(100/(\maxvalx-\midvalx)))))} \xdef\tempb{\pgfmathresult}% \cellcolor{\highcolx!\tempb!\midcolx!\opacityx}#1% }} }
%======================================

Saturday, November 5, 2011

Minted: Highlighted source code in LATEX

Minted is a LaTeX package that facilitates expressive syntax highlighting using the powerful Pygments library. The package provides options to customize the highlighted source code output.
The example below shows how C code is highlighted,  and the output is shown at right:

\documentclass{article}
\usepackage{minted}

\begin{document}

\begin{minted}{c}
int main()
{
  printf("hello, world");
  return 0;
}
\end{minted}

\end{document}

Pygments also provides a command line interface pygmentize, among the possible output formats there are HTML, RTF, LaTeX and ANSI sequences.
For command line highlighting a solid alternative to Pygments is GNU Source-highlight.


Source: http://mirrors.ircam.fr/pub/CTAN/macros/latex/contrib/minted/minted.pdf
A couple of on-line highlighters: http://www.hilite.me/http://quickhighlighter.com/

Tuesday, July 6, 2010

Gamma error in picture scaling

This is a very interesting reading: http://www.4p8.com/eric.brasseur/gamma.html.
The issue is that the luminosity is not a linear function of the graylevel value, therefore when downscaling an image the average of pixels should be weighted by the gamma function. Unfortunately this weighting is neglected in most image processing libraries.