Showing posts with label image. Show all posts

Friday, November 22, 2024

Brighten an \includeimage image in LaTeX Using decodearray without modifying the file

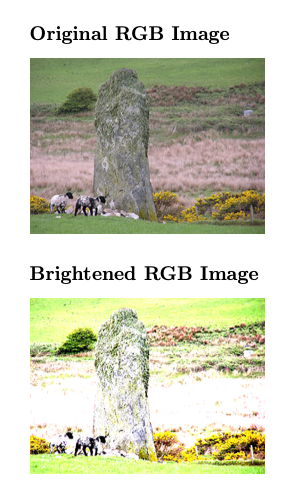
You can adjust the brightness of \includegraphics images in LaTeX without editing them!

The decodearray option in the graphicx package allows you to modify the appearance of images directly within your document.
This is especially useful if you need to tweak image brightness directly in your document without relying on external image editing tools.
The decodearray feature relies on PDF features supported by modern LaTeX engines  such as LuaLaTeX or XeLaTeX. 

\documentclass{article}
\usepackage{graphicx}
\begin{document}

% Original RGB image
\section*{Original Image}
\includegraphics[width=0.5\textwidth]{example-image.jpg}

% Brightened image using decodearray
\section*{Brightened RGB Image}
\includegraphics[width=0.5\textwidth, decodearray={0.2 0.5   0.2 0.5   0.2 0.5}]{uiskentuie_standing_stone.png}


\end{document}


In the example decodearray={0.2 0.5    0.2 0.5    0.2 0.5} maps the original range [0, 1] for each one of the three RGB channels to a narrower, brighter range [0.2, 0.5].

source: https://tex.stackexchange.com/questions/29227/can-includegraphics-be-used-to-change-an-image-color/150219#150219

Sunday, November 13, 2022

Fix your matplotlib colorbars!

Matplotlib colorbars are a mess, especially if using subplots I often get tall bars like in this case


but instead I wanted


This great article by Joseph Long describes this issue in detail and provides some solutions. 
The code for generating the first figure is

import matplotlib.pyplot as plt
from skimage import img_as_float, data, color, transform
from scipy import ndimage, signal, fft, io
import numpy as np
 
img = color.rgb2gray(img_as_float(data.astronaut()))
I1 = np.abs(fft.fft2(img, norm='ortho')**2)
 
#plt.figure(figsize=(7.5,2.5))
 
subplotnum=1
 
plt.subplot(1,2,subplotnum); subplotnum+=1
plt.imshow(img)
plt.colorbar()
plt.title('image')
 
plt.subplot(1,2,subplotnum); subplotnum+=1
plt.imshow(np.log(fft.fftshift(I1)+1e-6))
plt.colorbar()
plt.yticks([])           # desable yticks in the second image
plt.title('log spectrum')
 
plt.tight_layout(pad=0.4, w_pad=0.5, h_pad=1.0)
plt.show()   

A solution provided in the article consists in using a custom colorbar, the important changes are highlighted

import matplotlib.pyplot as plt
from skimage import img_as_float, data, color, transform
from scipy import ndimage, signal, fft, io
import numpy as np
 
def colorbar(mappable):
    from mpl_toolkits.axes_grid1 import make_axes_locatable
    import matplotlib.pyplot as plt
    last_axes = plt.gca()
    ax = mappable.axes
    fig = ax.figure
    divider = make_axes_locatable(ax)
    cax = divider.append_axes("right", size="5%", pad=0.05)
    cbar = fig.colorbar(mappable, cax=cax)
    plt.sca(last_axes)
    return cbar
 
img = color.rgb2gray(img_as_float(data.astronaut()))
I1 = np.abs(fft.fft2(img, norm='ortho')**2)
  
subplotnum=1
 
aa = plt.subplot(1,2,subplotnum); subplotnum+=1
ax = plt.imshow(img)
colorbar(ax)
aa.set_title('image', size=14)
 
aa = plt.subplot(1,2,subplotnum); subplotnum+=1
ax = plt.imshow(np.log(fft.fftshift(I1)+1e-6))
colorbar(ax)
aa.get_yaxis().set_ticks([])  # desable yticks in the second image
aa.set_title('log spectrum', size=14)
 
plt.tight_layout(pad=0.4, w_pad=0.5, h_pad=1.0)
plt.show()    

Saturday, February 23, 2019

Latex code and other tools for making neural networks diagrams


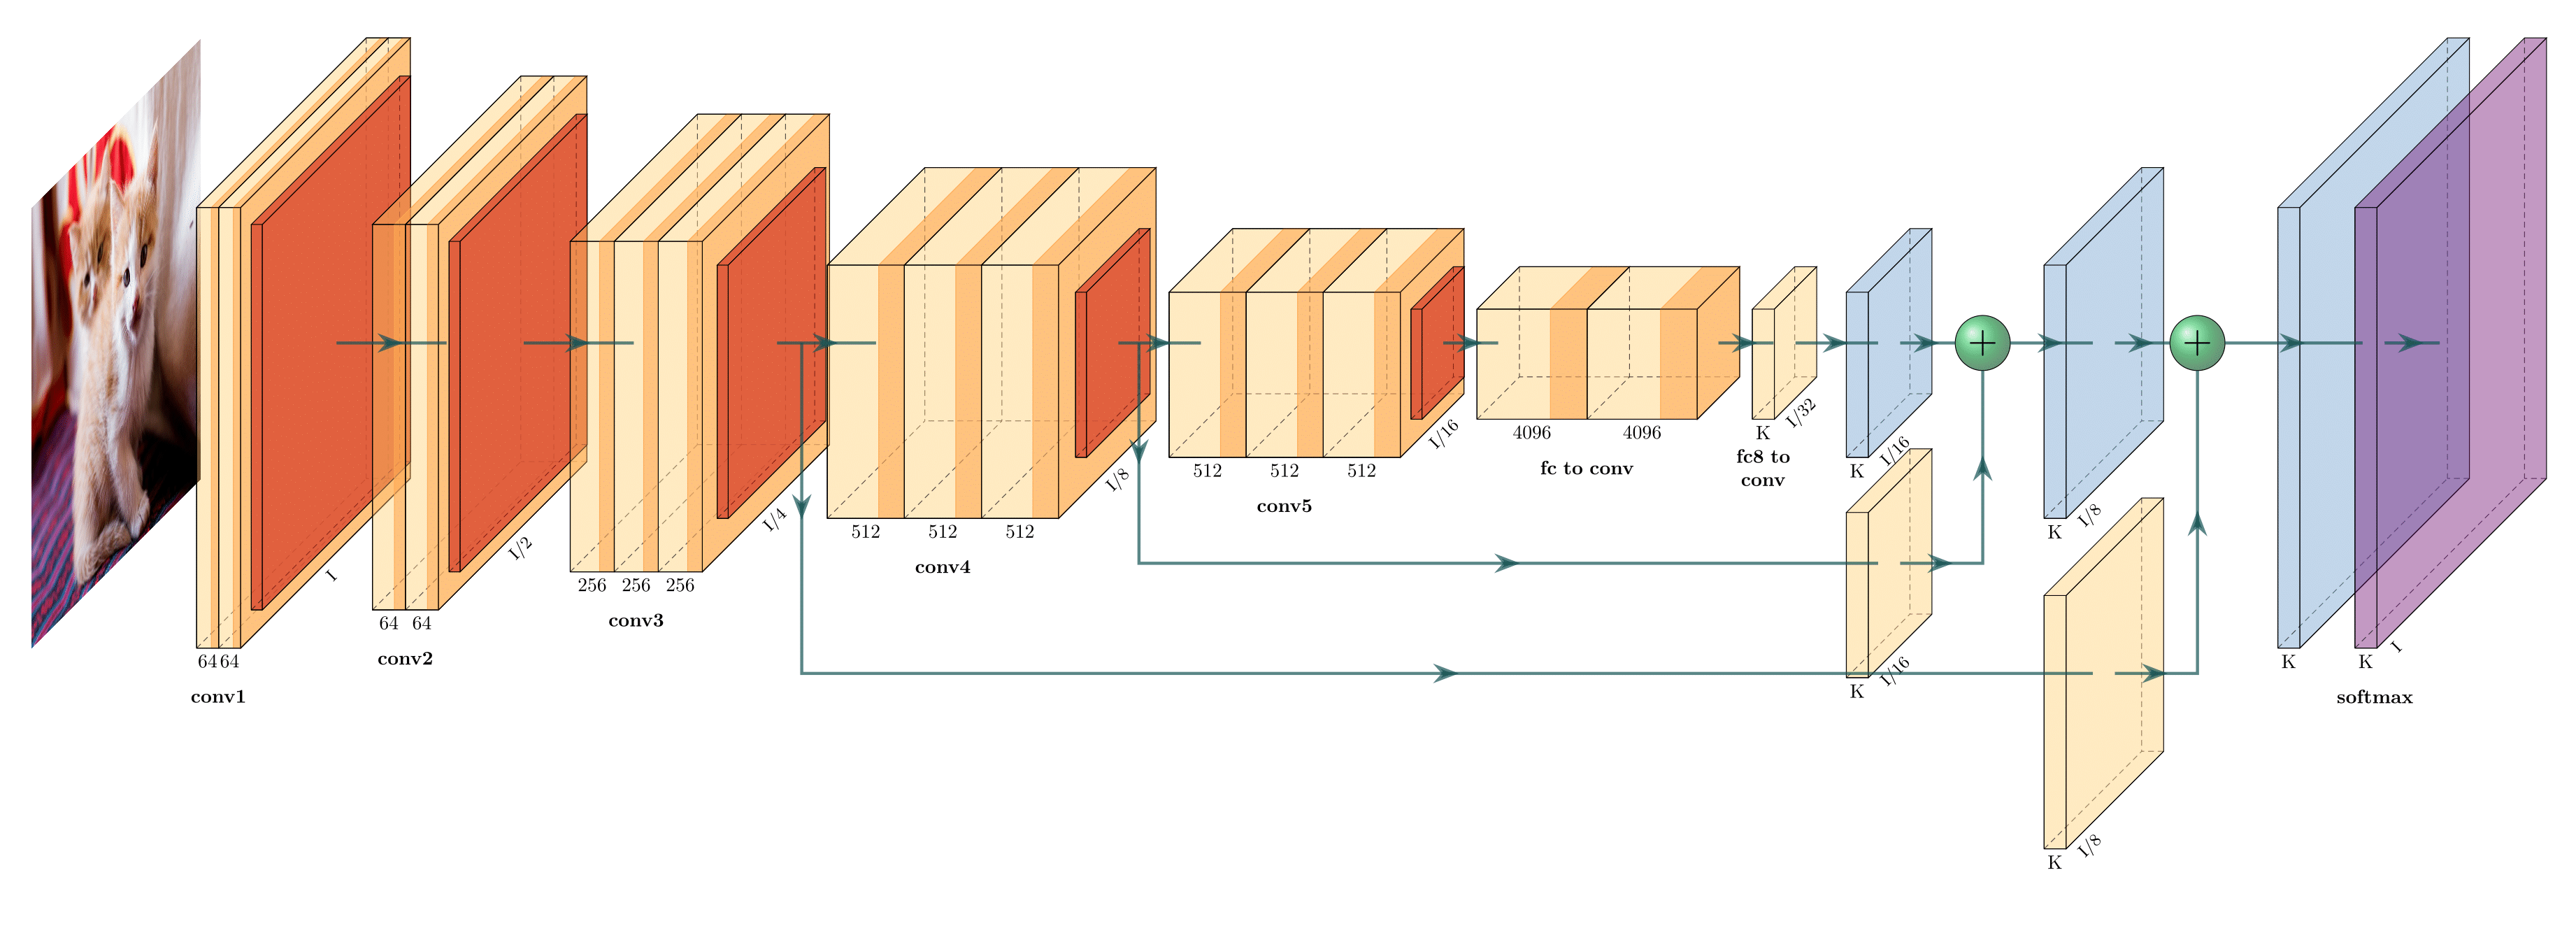
 PlotNeuralNet generates tikz code (for Latex) for illustrating a network architectures


NN-SVG is an online tool for illustrating simple architectures and that generates SVG code

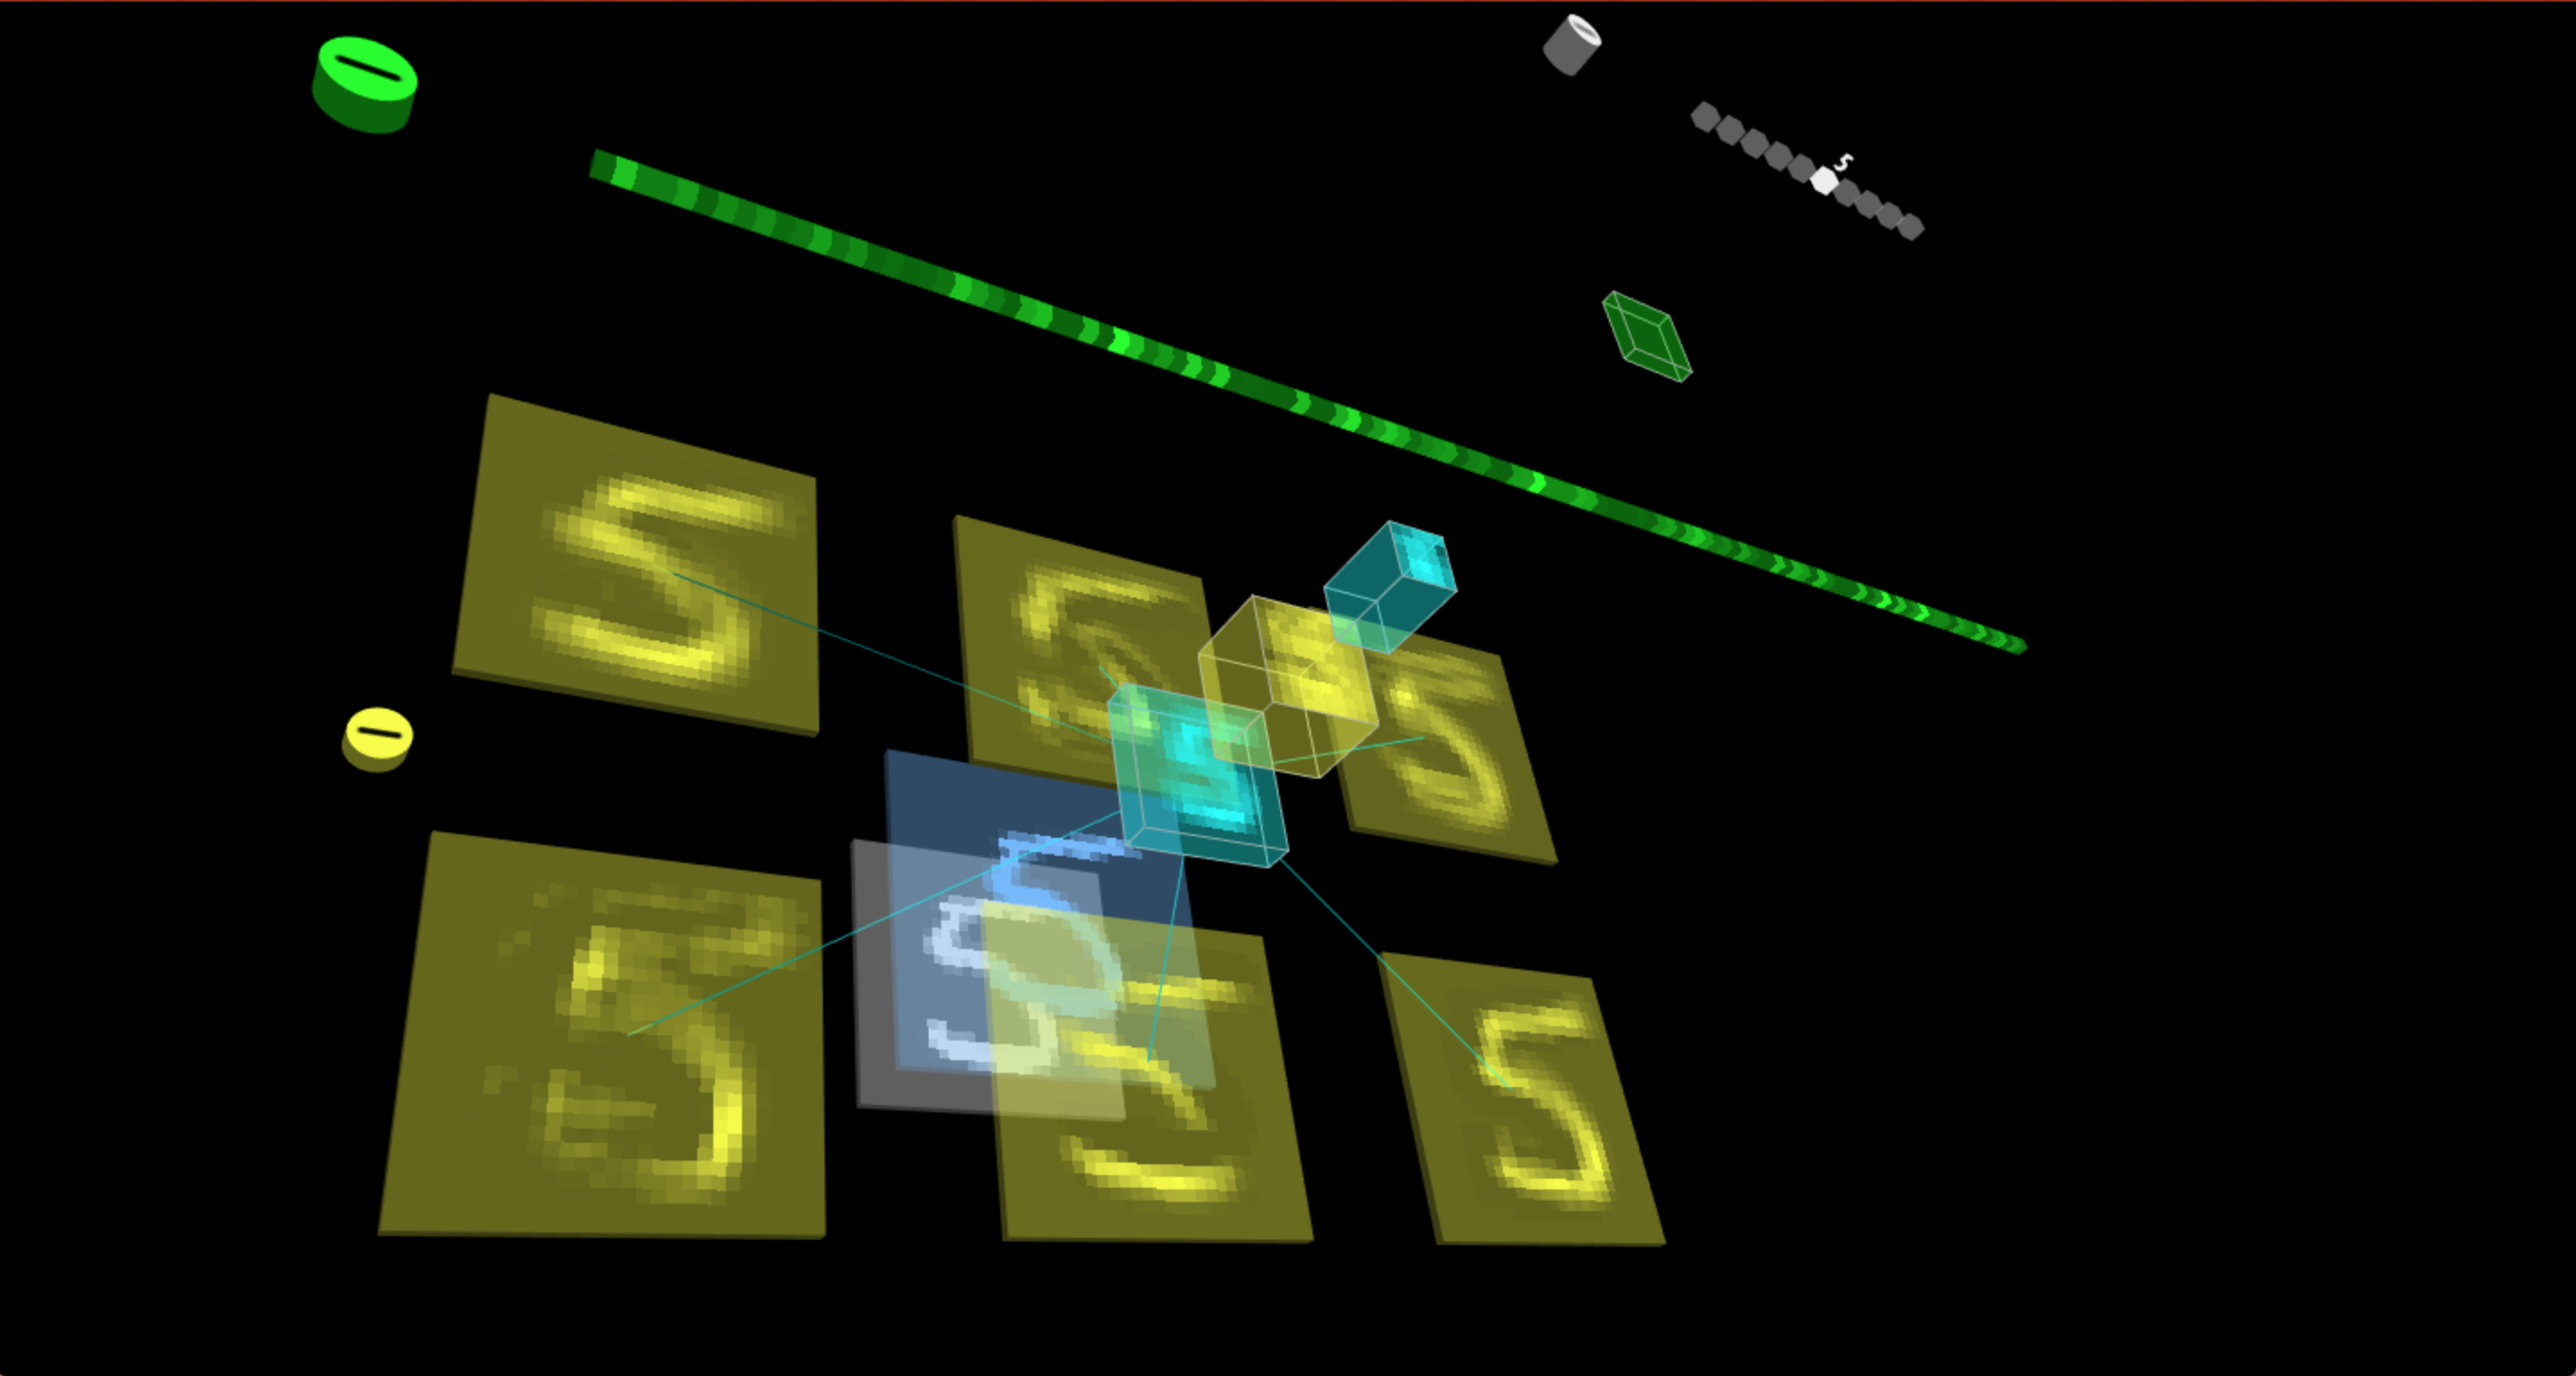
Tensorspace.js is a web-based tool that takes keras network definitions and produces beautiful 3D representations on the browser that are also functional!

Netscope is a web-based tool for visualizing neural network architectures for the moment only supports Caffe's prototxt format


Have a look at the stackexchange thread about this topic: https://datascience.stackexchange.com/questions/12851/how-do-you-visualize-neural-network-architectures

Sources:
https://github.com/HarisIqbal88/PlotNeuralNet
http://alexlenail.me/NN-SVG/LeNet.html
https://tensorspace.org/html/docs/startHello.html
http://ethereon.github.io/netscope/quickstart.html
https://www.draw.io/ (for manual drawing from elementary shapes)

Friday, September 14, 2012

Writing floating point multi-channel TIFFs in Matlab

In a previous post I've commented on how to read a multi-channel floating point TIFF in Matlab using the Tiff class (available since R2009b).
The Tiff class also permits to write all TIFF flavors. But since this TIFF format is so flexible, setting up everything for writing a file is not straightforward. Concretely I'm interested in writing a multi-channel floating point TIFF. Using the details found here, I've wrote this functions that wraps all the parameter setup for writing this type of TIFF files.
function writeTIFF(data, filename)
% writeTIFF(data, filename)
% writes data as a multi-channel TIFF with single prec. float pixels
   t = Tiff(filename, 'w');
   tagstruct.ImageLength = size(data, 1);
   tagstruct.ImageWidth = size(data, 2);
   tagstruct.Compression = Tiff.Compression.None;
   %tagstruct.Compression = Tiff.Compression.LZW;        % compressed
   tagstruct.SampleFormat = Tiff.SampleFormat.IEEEFP;
   tagstruct.Photometric = Tiff.Photometric.MinIsBlack;
   tagstruct.BitsPerSample =  32;                        % float data
   tagstruct.SamplesPerPixel = size(data,3);
   tagstruct.PlanarConfiguration = Tiff.PlanarConfiguration.Chunky;
   t.setTag(tagstruct);
   t.write(single(data));
   t.close();
Sources: http://www.mathworks.com/matlabcentral/answers/7184#comment_15023http://www.mathworks.fr/help/techdoc/ref/tiffclass.hhttp://www.mathworks.fr/help/techdoc/ref/tiffclass.htmltml

Sunday, May 13, 2012

Read floating point multi-channel TIFFs in Matlab >=R2009b

For reading a TIFF image in Matlab usually the imread function suffices:

d1 = imread('myfile.tif'); 

This call will even load single channel f32 (32bit floating point) images. But for multi-channel f32 images will fail. This is not a surprise, since most of the applications don't even load the single channel f32 files.

Starting from version R2009b Matlab includes a new Tiff class that implements much more of the TIFF format, allowing to read and write many flavors of TIFF files. The call is slightly different from imread: 

t = Tiff('myfile.tif'); 
d2 = t.read();

Sources: http://compgroups.net/comp.soft-sys.matlab/reading-64-bit-tif-image/405858
http://www.mathworks.fr/help/techdoc/ref/tiffclass.hhttp://www.mathworks.fr/help/techdoc/ref/tiffclass.htmltml

Friday, November 4, 2011

Hack to prevent Caching of Dynamic Images

Web caches are a necessary component of the web. So, when developing dynamic web contents it is important to be sure if an object is cached or not, otherwise the user may end up seeing some old cached content. The objective here is to block caching of images produced by a service which generates a new image in each call, so the image must be transmitted every time.

The HTML meta tags do not apply to the case of images (and their effectivity is even questionable for HTML pages). The HTTP cache directives are better suited for cache control since most of the web caches honor them. But they entail some customization of the web server in order to send the correct header for each file.

The simplest way to prevent caching of a dynamic image, is to change its url at each run. For that, one possibility is to completely change the filename. But a trick allows to keep the original filenames and still prevent caching, it consists in appending a random querysting to the filename like this:

<img src="output.png?r=1234">

the querystring is discarded by the webserver where output.png is. Still it is seen as a different object by the cache, causing the image to be reloaded every time the page is loaded. 


Source: http://www.itsjustpoison.com/blog/2008/05/12/trick-prevent-image-caching-of-dynamic-images
Source: http://www.i18nguy.com/markup/metatags.html
Reading: http://www.mnot.net/cache_docs/

Thursday, September 15, 2011

MegaWave2 V3.01 - "Advanced - Ultimate" for OS X 10.6.8

I'm addressing again the installation of Megawave 2 V3.01, this time in OS X 10.6.8 (Snow Leopard).
A default installation of Snow Leopard uses a 32bits kernel, but which can run both: 32 and 64bits applications. This implies that all the system libraries are complied for both architectures.

Megawave however, is not 64bit-friendly so it mut be compiled as a 32bits application. The patches I've made are centered on enforcing a 32bits compilation at all stages of the Installation.
To avoid complications related the dependence on libtiff and libjpeg (which must be also compiled in 32bits), I've opted to include them in the package and compile them as part of Megawave installation.
The compiled libraries are stored inside Megawave library path sys/lib/ix86, so they do no interfere with other system libraries.

The resulting package only requires the gcc compiler, which can be either 4.0 or 4.2.

The installation should go as follows:

Monday, May 23, 2011

Fishtank VR project with OpenCV and OpenGL

A toy Fishtank VR application I've made using OpenCV. It uses head tracking to adjusts the view according to the position of the viewer (see related posts).
The OpenGL projection matrix was modified to allow rendering objects in front of the projection plane (the window) so that objects can "pop out" the screen.

TODO:
  • Stabilize the head tracking, using templated object search 
  • Calibrate the paralax factor, the apparent motion is not very realistic
  • Replace bitmap reading routines
  • Refactor 

Download the code. 
Builds with Xcode, but requires the OpenCV Framework to be installed. Also compiles with cmake in linux.

Similar projects:
http://www.tuaw.com/2011/04/11/ipad-2-gets-glasses-free-3d-display-using-front-facing-camera-fo/

Monday, October 25, 2010

Including videos in PDF using pdflatex

The mandatory reference for this topic is: http://pages.uoregon.edu/noeckel/PDFmovie.html

The summary is that, the movie15 parckages allows to produce a PDF files with links to videos and animations. The videos must be located on the same directory as the PDF, and for building pdflatex must be invoked several times (4 in my case). As a result the movie is encapsulated in the PDF file, and in order to view the embedded movie, you need to open it with Adobe Reader or Acrobat.


\documentclass[12pt,landscape]{article}
\usepackage{geometry}
\geometry{verbose,letterpaper}
\usepackage{movie15}
\usepackage{hyperref}


\begin{document}
    \includemovie[ poster,  text={Loading Video} ]{6cm}{6cm}{Circle-m-increase3.mp4}
    % ALSO WORKS WITH .avi AND .mov IN OSX
\end{document}

Tuesday, July 20, 2010

Total Variation image regularization in CUDA

Lately I've been playing with NVidia's CUDA language. As a result two Total Variation regularizers were implemented, one is Chambolle's dual method the other is Zhu and Chan's primal dual method.

Original and TV regularized image.

The CUDA implementation of both methods, when running on GeForce 9400M, is 4 times faster than the CPU version; and 15 times faster when running on GeForce GTX 285.
I must confess that I'm a little disappointed, I expected a ~100x speed-up with the GTX 285. Probably the speed-up is proportional to the coding skills :(

There is no stop condition for the algorithms other than the number of iterations, but the Zhu and Chan algorithm exhibits faster convergence than Chambolle's.

One of the most remarkable performance boosts came from the use of structures of arrays. Basically instead of storing a vector valued image as [ (u0,v0),(u1,v1),(u2,v2), .... ] , storing two arrays [ u0,u1,u2, .... ]  and [ v0,v1,v2, .... ]  favors the coalesced memory access.

Download the code. Tested on OSX and Linux.

Monday, July 12, 2010

Binary GIMP for OSX including resynthesizer plugin

Resyntesizer is a GIMP plugin from Paul Harrison for texture synthesis and image completion, it provides the same functionality similar to Potoshop's content aware filters.
Thanks to Alfonso for pointing me out this link.

 >>

A binary GIMP distribution for OSX (dmg format) that includes the resynthesizer plugin is available at http://gimp.lisanet.de/Website/Download.html.


Other Sources:
http://www.hutsby.net/2010/04/howto-use-resynthesizer-for-gimp-on-osx.html

Saturday, July 10, 2010

Draw vector fields with gnuplot.

To plot a data file that contains motion vectors formated as
x1 y1 u1 v1
x2 y2 u2 v2
...
xN yN uN vN
where for each row (x,y) is the position of the vector and (u,v) is its magnitude, use the command

plot "motion_vectors.data" using 1:2:3:4  with vec


this plots small vectors at each position (x,y). 
If we want to plot only some of the points (because the field is dense) we use  the every 4:4 option, and scale the vectors by 4 


plot "motion_vectors.data" every 4:4 u 1:2:($3*4):($4*4) w vec

To overprint the vectors on an image (with gnuplot 4.2). The image must be stored as a binary file image.bin and the size of the image must be known 300x400.


plot "image.bin" binary array=300x400 flipy with image, "motion_vectors.data" every 12:12 u 1:2:($3*8):($4*8) w vec

Sometimes other adjustements are necesarry to the plots, just manipulate: ($1):($2):($3*8):($4*8)


References:
http://t16web.lanl.gov/Kawano/gnuplot/datafile2-e.html#7.6
http://www2.yukawa.kyoto-u.ac.jp/~ohnishi/Lib/gnuplot.html
http://gnuplot.sourceforge.net/demo/image.html

Tuesday, July 6, 2010

Gamma error in picture scaling

This is a very interesting reading: http://www.4p8.com/eric.brasseur/gamma.html.
The issue is that the luminosity is not a linear function of the graylevel value, therefore when downscaling an image the average of pixels should be weighted by the gamma function. Unfortunately this weighting is neglected in most image processing libraries.

Tuesday, June 29, 2010

Adapt OpenGL projection matrix to show objects behind the projection plane


In OpenGL the projection operation is defined by the projection matrix, and the objects drawn in the screen are inside the rendering volume defined by the left/right, upper/lower and near/far boundaries of a frustum (truncated pyramid). The projection plane is generally the near plane. The function glfrustum generates a projection matrix with these characteristics.


However there is a problem with the projection defined by glfrustum. Virtual objects in front of the near plane are not shown. However we whould like to show them as well.


The problem is that glFrustum produces a projection matrix that implicitly sets the near plane as a clipping one. Fortunately this can be fixed after understanding how OpenGL performs the clipping test (read http://www.songho.ca/opengl/gl_projectionmatrix.html).


Let's see how the 3d homogeneous coordinates of the scene are rendered.
  • First the the scene is transformed (mainly to position all the objects) with the GL_MODELVIEW matrices.
  •  Second the projection matrix is applied, its task is to convert the rendering volume to NDC (Normalized Device Coordinates) shown below. The NDC are still 3d homogeneous coordinates with w != 1. 
  • Third the vectors (x,y,z,w) are divided by w, the resulting vectors (x/w,y/w,z/w) that have coordinates in [-1,1]^3 are rendered everything that's outside the cube is clipped (discarded). The positions of each 3d point in the screen is "practically the same as" by (x/w,y/w) (I'm skipping other 2d transformations), and the z/w coordinates are fed to the z-buffer. 


The glfrustum projection matrix is


[ 2n/(r-l)   0      (r+l)/(r-l)    0       ]
[ 0       2n/(t-b)  (t+b)/(t-b)    0       ]
[ 0          0     -(f+n)/(f-n) -2fn/(f-n) ]
[ 0          0         -1          0       ]


where n,f<0 are the coordinates of the near and far planes, l,r,t,b are respectively the (left,right,top,bottom) coordinates, all the coordinates are with respect to the viewer position (the origin). In order to display objects in front of the projection plane we need to modify the projection matrix. We want points (x,y,z) with near<0, to be shown. These points are clipped by the glfrustum's matrix since [near, far] is mapped to the range [-1,1].


Observe that the first two rows compute the (x,y) coordinates of the points in the screen, but we are not interested in changing them.
The third row maps [near,far] to [-1,1], ideally we want to have a mapping [q,far] to [-1,1] with 0>q >near. It is easy to see that the following matrix performs this map


[ 2n/(r-l)    0      (r+l)/(r-l)    0       ]
[    0     
2n/(t-b)  (t+b)/(t-b)    0       ]

[    0        0     -(f+q)/(f-q) -2fq/(f-q) ]
[    0        0          -1         0       ]

The glfrustum matrix can be corrected with


/* Compute the projection matrix */
glMatrixMode(GL_PROJECTION);
glLoadIdentity();
glFrustum( -1.0 + X , 1.0 + X, /* left, right */
           -1.0 + Y , 1.0 + Y, /* botom,top*/
           ZNEAR_proj - Z,     /* Z near: the projection plane!*/
           ZFAR                /* Z far */ );

/* Recover the current matrix */
GLfloat projectionMatrix[16];
glGetFloatv(GL_PROJECTION_MATRIX,projectionMatrix);
/* Modify the entries */
projectionMatrix[10]=(-ZFAR-ZNEAR_clip)/(ZFAR-ZNEAR_clip);
projectionMatrix[14]=(-2*ZFAR*ZNEAR_clip)/(ZFAR-ZNEAR_clip);
/* Load the modified matrix */
glLoadMatrixf(projectionMatrix);


On projections: http://www.ecse.rpi.edu/Homepages/wrf/Research/Short_Notes/homogeneous.html

Thursday, October 1, 2009

MegaWave2 V3.01 in OS X 10.5.7

Megawave is an image processing library from for UNIX, developed at CMLA Cachan.
Compiling it's current version (3.01) under OS X is a truly painful task.
From the experiences of Said, Jeremie and Rafa, I've managed to stitch
together a version that works under OS X 10.5.7 and 10.5.8 using the gcc-4.0.1 compiler.

Requieres Xtool, and a lot of Fink/MacPorts packages i.e. libtiff y libjpeg, (I should someday compile a complete list of dependences).

During the installation process:
when asked for X11 path, answer : /usr/X11/lib/ ,
when asked for the libtiff & libjpeg paths, answer: /sw/lib/ or /opt/local/lib/ or wherever these libraries are in your system.
  • In case you are running 10.5.8 the default compiler is gcc-4.2 and it will not work. So the trick is to link cc to gcc-4.0 ( 'ln -s /usr/bin/cc /usr/bin/gcc-4.0' ) during the installation process. 
  • A common cause of problems is the specification of the include directories for libtiff and libjpeg (/opt/local/include or /sw/include or whatever), these are hardcoded in the installation. In this case just modify the CFLAGS parameter in ./kernel/lib/src/Makefile.in to reflect your configuration.
  • A VERY IMPORTANT TIP. During the installation process some configuration files are generated, and they are not overwritten by running the installation again. So if the compilation fails, any change of parameters/files should be performed on the clean unpacked version
Good luck with it : MegaWave2_V3.01.osx10.5.8.tgz

Tuesday, September 22, 2009

VTK and OS X

This is a true mess.


I am currently using vtk54-cocoa + pyvtk-py24
and VTK works with hardware acceleration.